See how an industry is valued, then run the numbers yourself.
Thirty industries, each with a primer and the Excel model that runs its worked valuations.
From £25 a primer · £59 with its Excel model · £159 for all three in a sector
- free guides
- 218
- company profiles
- 173
- pages across the primers
- 1,243
- Excel model sheets
- 354
Ten sectors, thirty industries
Each sector page holds its industries' free guides, company profiles and primer.


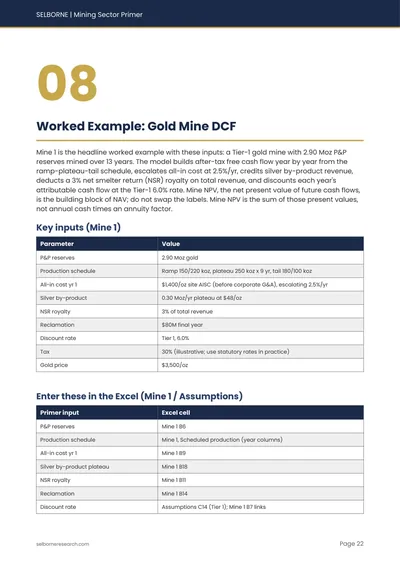
Section 08, the worked Gold Mine DCF: the Mine 1 inputs and the exact Excel cells they map to.
Inside a primer
Cost curves and reserves are the inputs. This primer takes them to a per-mine NAV.
Mining Sector Primer · 2026 Edition · data as of June 2026
- 15 sections, WGC cost curve
- 44 pages
- single mine + three-mine sum-of-parts
- 2 worked NAVs
- producers, a developer and an explorer
- 6-company set
- Worked valuations
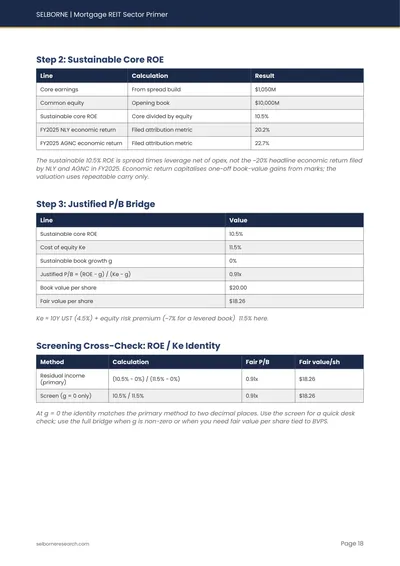
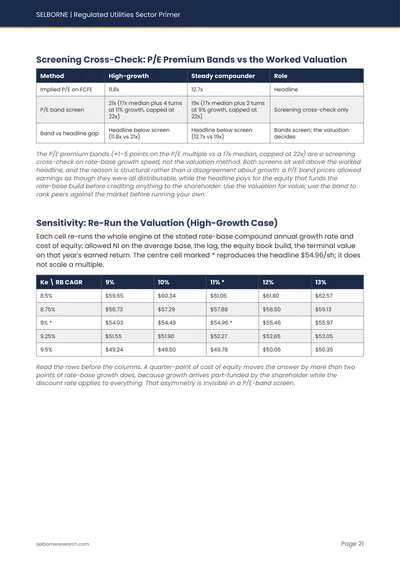
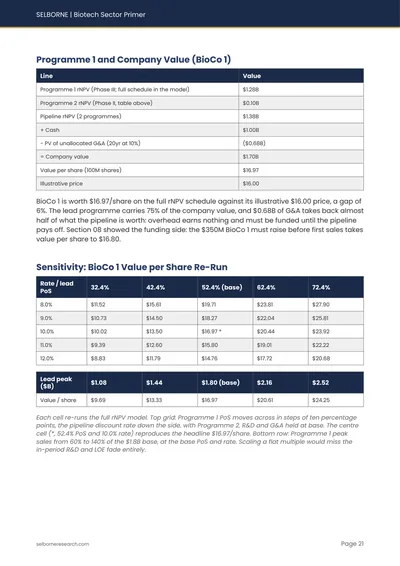
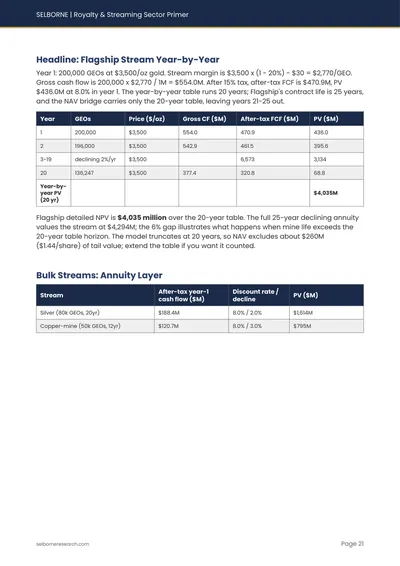
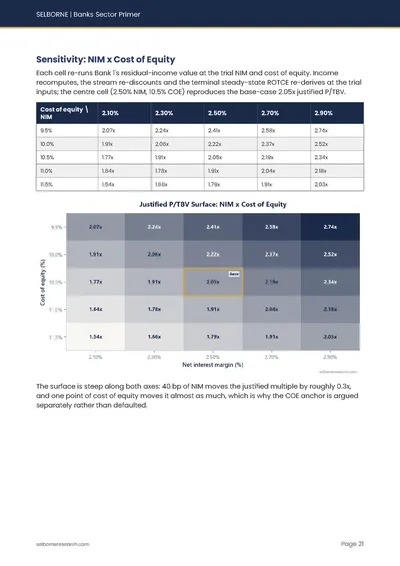
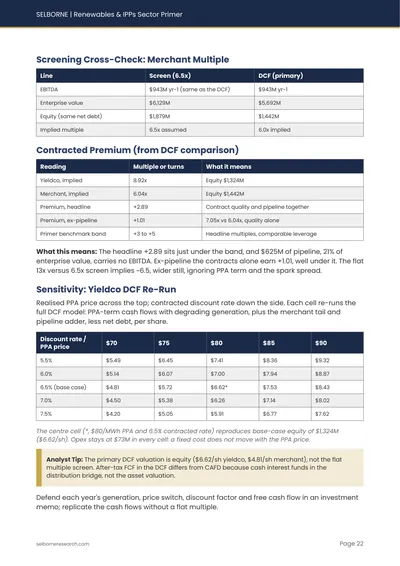
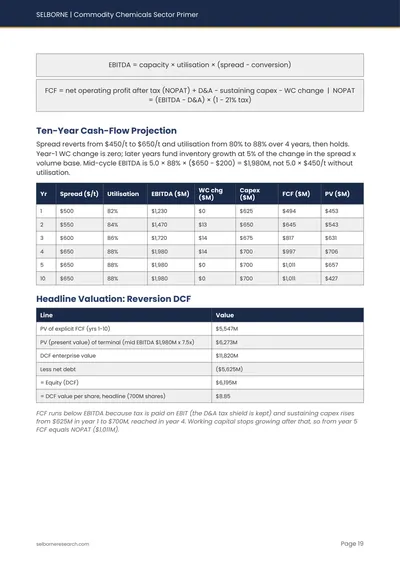
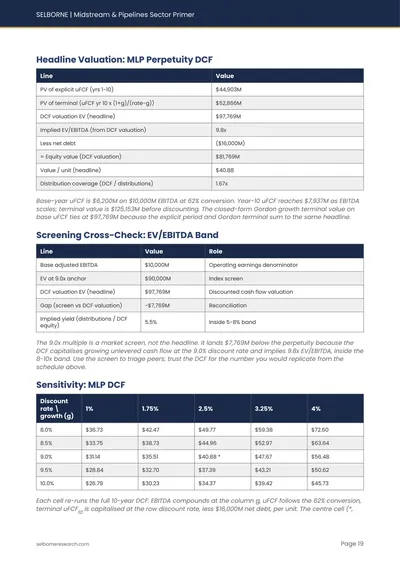
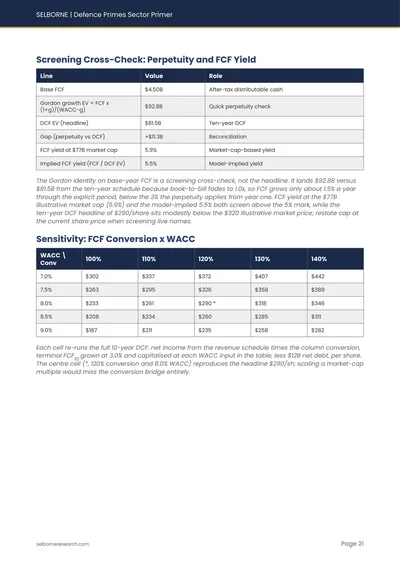
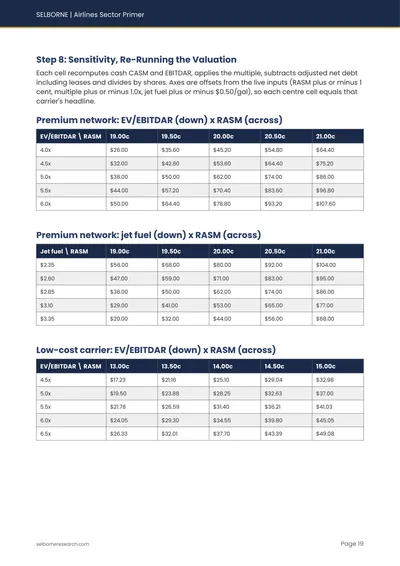
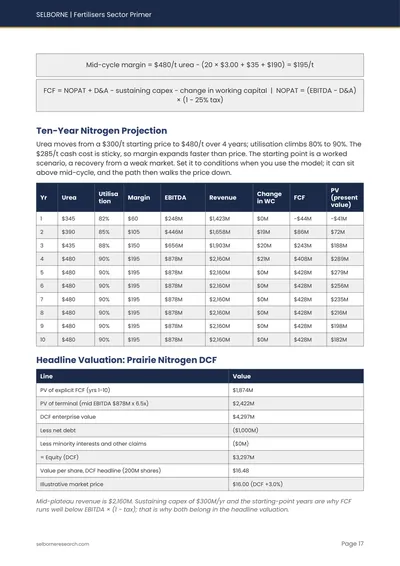
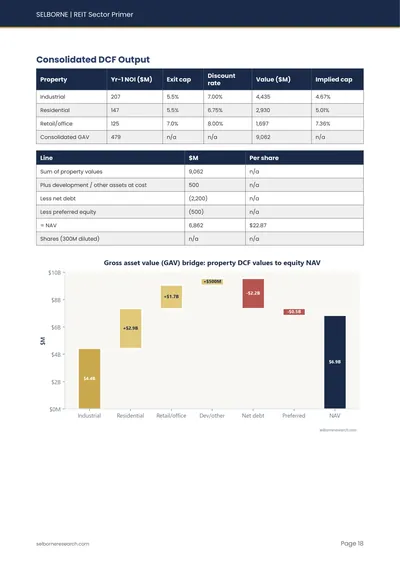
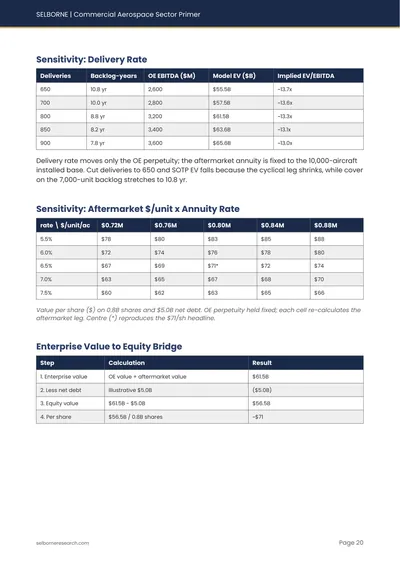
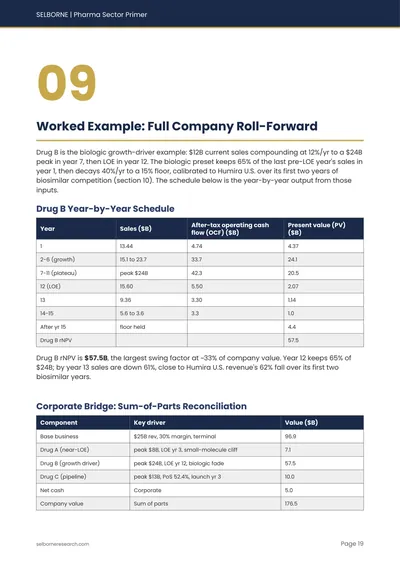
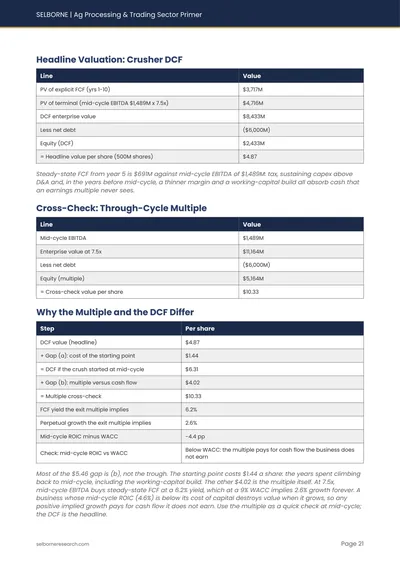
- Each primer carries its methods from first input to final number in worked examples and applied cases. The calibrations are illustrative, not fair-value estimates for any company.
- The Excel model
- Each primer has a companion Excel model that runs its worked valuations live: change an input and the value moves.
- Dated editions
- Every primer page states its edition and the month its data runs to, so you know what the figures describe.
Educational material. Nothing here is investment advice or a recommendation on any security.
Newest guides
- REIT Net Debt to EBITDA by Company: 2025 Ranked REITs · 5 October 2026
- Defence Prime Segment Margin Benchmarks Defence Primes · 4 October 2026
- Insurer Expense Ratio Benchmarks: FY2025 Ranked Insurance · 4 October 2026
- Refinery Operating Cost per Barrel: FY2025 Ranked Refining · 4 October 2026
- Fertiliser EBITDA per Tonne by Nutrient Fertilisers · 29 September 2026
Company research
See our methodology in action. Each profile applies the frameworks from our primers to a real public company.